
|
Chapter 4 is the Results section of your research paper. According to Annesley (2010), "the results section is where you report the findings of your study based upon the methodology [or methodologies] you applied to gather information. The results section should state the findings of the research arranged in a logical sequence without bias or interpretation."
|
Specific Requirements for Chapter 4: Results
As discussed in detail below, Chapter 4: Results must contain the following.
|
•Raw Data (Table)
•Summary Table that contains..
•Summary of Findings |
Raw Data
Simply put, this is a table that shows what the scores were for each participant in the experimental group and each participant in the control group. For example, here is the Raw Data for an experiment that measured how many nonsense syllables were recalled by a control group that did not listen to music while recalling the syllables and an experimental group that did listen to music while recalling the syllables
|
|
Raw Data - Number of Nonsense Syllables Recalled
|
Control Group - No Music
10 12 14 12 15 16 11 12 |
Experimental Group - Music
9 10 9 5 7 10 9 9 |
Summary Table
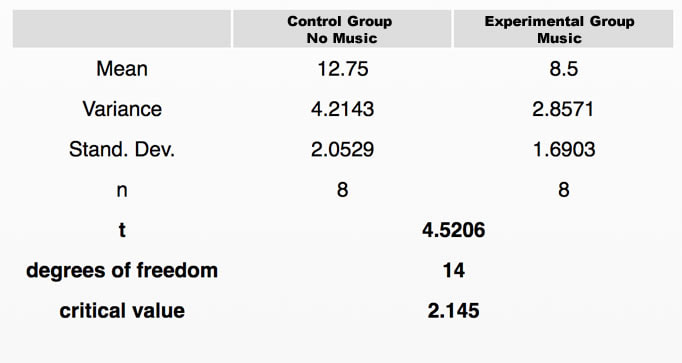
Using the T-Test Calculator, create a summary table of your results. Refer to classroom discussion for more information and instruction. An example of a summary table appears below.
Summary Table

Teacher-Led Activity
|
T-Test Calculator |
Distribution
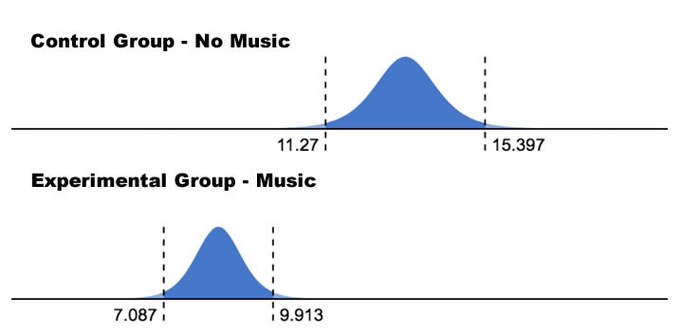
Using Evan's Awesome Tools, create a graphic that shows the distribution of the control group and the distribution of the experimental group. Refer to classroom discussion for more information and instruction. An example of a Distribution appears below.
Distribution

Teacher-Led Activity |
Evan's Awesome Tools |
Summary of Findings
The Summary of Findings should restate the mean for the control group and experimental group, the difference between the means, and whether there is a significant difference between the mean of the control group and the mean of the experimental group. Below is an example of a Summary of Findings for the results reported above.
Summary of Findings
The mean for the Control Group - No Music was 12.75. The mean for the Experimental Group - Music was 8.5. The difference between the music group and the non-music group was 4.25. The calculated value for t is 4.5206. The critical value is 2.145. The calculated t exceeds the critical value (4.5206>2.145), so the means are significantly different.
The mean for the Control Group - No Music was 12.75. The mean for the Experimental Group - Music was 8.5. The difference between the music group and the non-music group was 4.25. The calculated value for t is 4.5206. The critical value is 2.145. The calculated t exceeds the critical value (4.5206>2.145), so the means are significantly different.
Complete Example of Chapter 4: Results
Chapter 4: Results
Raw Data - Number of Nonsense Syllables Recalled
|
Experimental Group - Music
9 10 9 5 7 10 9 9 |
Control Group - No Music
10 12 14 12 15 16 11 12 |
Summary Table
Distribution
|
Summary of Findings
The mean for the Control Group - No Music was 12.75. The mean for the Experimental Group - Music was 8.5. The difference between the music group and the non-music group was 4.25. The calculated value for t is 4.5206. The critical value is 2.145. The calculated t exceeds the critical value (4.5206>2.145), so the means are significantly different. |
